I created Path::Tiny because I wanted a faster file path utility. But believing it would be faster isn’t the same thing as demonstrating it, so I decided to create some benchmarks. That got complicated, but now I have a pretty nice benchmarking toolkit.
This article describes my setup and process and shows results for object creation and basic file path manipulations for Path::Tiny and three other file path utilities: Path::Class, IO::All and File::Fu.
In subsequent articles, I’ll show benchmarks for file input and output, including some startling facts about Unicode slurping.
tl;dr: Path::Tiny is really fast!
Goodbye Benchmark, hello Benchmark::Forking 🔗︎
Hopefully, you’ve heard of the good-old Benchmark module. It’s a good starting point for benchmarking Perl programs. Or is it?
Even if you’ve used it, you might not realize that Benchmark runs tests in alphabetical order, doing all the loops for one test before going onto the next. Because prior runs affect Perl’s memory allocation, test names can affect benchmarking results.
Here’s a demonstration of what can happen. All the test subs are the same – they just slurp a 1 megabyte file – so the only difference is the name:
use v5.10;
use strict;
use warnings;
use Benchmark qw( cmpthese );
use Path::Tiny;

my $file = "ascii-large";

my $count = -1;
cmpthese(
    $count,
    {
        map { $_ => sub { path($file)->slurp } } ("a" .. "l")
    }
);
And here is the result:
$ perl bench.pl
    Rate    l    h    i    j    f    b    g    c    a    e    k    d
l 1599/s   -- -14% -15% -19% -20% -20% -21% -21% -21% -23% -23% -23%
h 1866/s  17%   --  -1%  -6%  -6%  -7%  -8%  -8%  -8% -10% -10% -10%
i 1879/s  17%   1%   --  -5%  -6%  -6%  -8%  -8%  -8%  -9%  -9%  -9%
j 1981/s  24%   6%   5%   --  -1%  -1%  -3%  -3%  -3%  -4%  -4%  -4%
f 1995/s  25%   7%   6%   1%   --  -0%  -2%  -2%  -2%  -3%  -4%  -4%
b 1999/s  25%   7%   6%   1%   0%   --  -2%  -2%  -2%  -3%  -3%  -4%
g 2033/s  27%   9%   8%   3%   2%   2%   --  -0%  -0%  -2%  -2%  -2%
c 2035/s  27%   9%   8%   3%   2%   2%   0%   --  -0%  -2%  -2%  -2%
a 2036/s  27%   9%   8%   3%   2%   2%   0%   0%   --  -1%  -2%  -2%
e 2067/s  29%  11%  10%   4%   4%   3%   2%   2%   2%   --  -0%  -0%
k 2070/s  29%  11%  10%   4%   4%   4%   2%   2%   2%   0%   --  -0%
d 2074/s  30%  11%  10%   5%   4%   4%   2%   2%   2%   0%   0%   --
Wow! Sucks to be called “l”, doesn’t it! The better letters outperform you by 30%!
With volatility like that, how can you possibly draw useful conclusions?
I hoped that someone had already encountered this and figured out a fix, so I checked CPAN. There, I found Benchmark::Forking, which monkeypatches Benchmark to run each test in a subprocess.
Here is that code. Notice that Benchmark::Forking is a drop-in replacement.
use v5.10;
use strict;
use warnings;
use Benchmark::Forking qw( cmpthese );
use Path::Tiny;

my $file = "ascii-large";

my $count = -1;
cmpthese(
    $count,
    {
        map { $_ => sub { path($file)->slurp } } ("a" .. "l")
    }
);
And now the results. Yes, there’s variance, but it’s much, much smaller:
$ perl forking.pl
    Rate   l   c   i   g   k   b   e   a   d   h   j   f
l 1982/s  -- -1% -1% -2% -3% -3% -4% -4% -4% -4% -5% -5%
c 2000/s  1%  --  0% -1% -2% -2% -3% -4% -4% -4% -4% -4%
i 2000/s  1%  0%  -- -1% -2% -2% -3% -4% -4% -4% -4% -4%
g 2018/s  2%  1%  1%  -- -1% -1% -2% -3% -3% -3% -4% -4%
k 2036/s  3%  2%  2%  1%  --  0% -1% -2% -2% -2% -3% -3%
b 2036/s  3%  2%  2%  1%  0%  -- -1% -2% -2% -2% -3% -3%
e 2055/s  4%  3%  3%  2%  1%  1%  -- -1% -1% -1% -2% -2%
a 2074/s  5%  4%  4%  3%  2%  2%  1%  --  0%  0% -1% -1%
d 2074/s  5%  4%  4%  3%  2%  2%  1%  0%  --  0% -1% -1%
h 2074/s  5%  4%  4%  3%  2%  2%  1%  0%  0%  -- -1% -1%
j 2093/s  6%  5%  5%  4%  3%  3%  2%  1%  1%  1%  --  0%
f 2093/s  6%  5%  5%  4%  3%  3%  2%  1%  1%  1%  0%  --
**Benchmark::Forking FTW!
**
DRY benchmarks 🔗︎
I wrote a lot of benchmarks. After the first half dozen, I realized that I was copying and pasting the same files over and over. What a huge code smell! While there might be a module out there to implement modular benchmarks (let me know in comments), I opted for some quick and dirty code generation instead.
I grouped snippets of benchmarking code into subdirectories and wrote a harness that read the snippets, wrapped a shell of code around them, dumped them into files, ran them, and gathered the results.
Here is the code shell, which I kept in a HERE document. The words in all caps were replaced by substitution to customize each test. (DIY templating.)
#!/usr/bin/env perl
use v5.10;
use strict;
use warnings;

use Benchmark qw( :hireswallclock );
use Benchmark::Forking qw( timethese );
use JSON -convert_blessed_universally;
use File::pushd qw/tempd/;

use File::Fu;
use IO::All;
use Path::Class;
use Path::Tiny;

my $count = COUNT;
my $corpus = path("CORPUS");
my $test = path("TEST");
my $result;

TIMETHESE

print JSON->new->allow_blessed->convert_blessed->encode($result);
The variables like $corpus are fixtures that I wanted available to all the benchmark snippets. The $result variable gets set in the snippet and communicated back to the harness via JSON.
The TIMETHESE marker is replaced by a snippet of benchmarking. Here is one for slurping an ASCII file. It determines a file to slurp based on the name of the test, and then gets the results of timing tests (the “none” stops output so we don’t mess up the JSON return).
my $size = $test->basename;
my $file = $corpus->child("ascii-$size");
die "Couldn't find $file" unless $file->exists;

$result = timethese (
    $count,
    {
        'Path::Tiny'  => sub { my $s = path($file)->slurp },
        'Path::Class' => sub { my $s = file($file)->slurp },
        'IO::All'     => sub { my $s = io($file)->slurp },
        'File::Fu'    => sub { my $s = File::Fu->file($file)->read },
    },
    "none"
);
I created that file as “small”, so it would slurp the “ascii-small” corpus. Then I just symlinked it to “medium”, “large”, and “huge” and had tests for those corpuses (corpi?) corpora as well without any extra code to write. DRY!
You can see the benchmark harness code on Github.
Pictures worth a thousand words 🔗︎
With so many benchmarks, trying to make sense of it from ASCII tables would be crazy. I was inspired by the cool charts in Ricardo’s blog about file finder speed, so I copied his code out of his repository and customized it.
It used Chart::Clicker, and getting that installed wasn’t as easily as I’d have liked. Finally, I figured out I had to install Cairo development libraries, and even then, I had to force install Chart::Clicker despite some test failures. Nevertheless, it worked.
Here’s what my code does:
- Reads in benchmark data from a JSON file
- Pivots the data from benchmark-module to module-benchmark
- Chooses an order to display benchmarks (e.g. descending by worst performance)
- Converts data to logarithms
- Adds data series to a chart object
- Formats the chart
The worst part was getting the chart formatting the way I wanted it. It took a lot of trial and error.
It’s more or less what you would do with a spreadsheet, just done in Perl instead. And once it was written, I could use the same code to generate charts for all the different benchmark groups – something I wouldn’t want to do over and over in Excel.
You can also see the chart code on Github.
Next, I’ll show some results.
Comparing file object creation 🔗︎
One of the first design goals I had for Path::Tiny was making object construction as cheap and lazy as possible because I’d seen in Ricardo’s file-finding exercise just how costly that can be when iterating over a lot of files.
I was particularly curious how construction times might vary along several dimensions:
- file objects versus directory objects
- paths that exist or not
- single level versus nested paths
- absolute versus relative paths
I wound up with twelve benchmarks across those variations, which I plotted on a log-scaled axis.
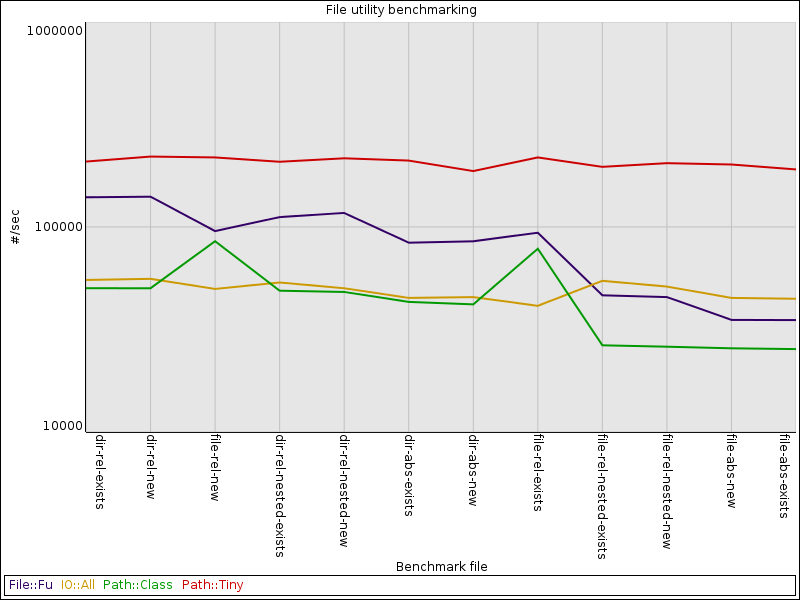
As I had hoped, Path::Tiny absolutely crushed the others across all benchmarks.
Path::Class and File::Fu drop off precipitously for absolute files and relative files that are nested, possibly because they create directory objects inside the file object, so two objects get created for every file object.
The flip side is that Path::Class spikes for a single-level, relative file (whether it exists or not), possibly because it’s not creating an expensive directory object.
IO::All is consistent, but slow. It seems to be doing a lot of work in its constructor.
Object construction is a very synthetic baseline. In the real world, we actually want to manipulate those paths and the files or directories they represent. Still, it’s built-in overhead and any method that returns another object is going to incur that overhead more than once.
Comparing file path manipulation 🔗︎
Next, I looked at several types of path manipulation:
- Getting a child path (file or subdirectory)
- Finding a basename
- Relative to absolute (and vice versa)
- Finding a parent directory
- Finding the contents of a directory
I wound up with ten benchmarks. These are also plotted on a log scale. While the axis scaling differs from the last chart, you’ll still be able to see how speeds drop off from the prior chart.
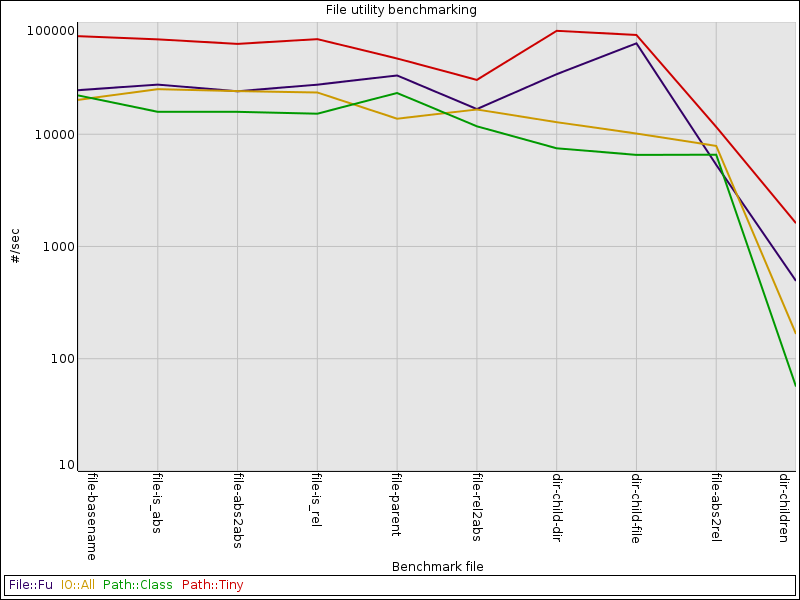
Once again, Path::Tiny comes out on top!
File::Fu performs pretty well, and is nearly as fast as Path::Tiny at generating a new object for a file in a directory.
Everything performs similarly at converting an absolute path to a relative one, in part because it’s sufficiently tricky that Path::Tiny falls back to using File::Spec like the other modules.
The slowest benchmark is the directory listing one. This consisted of reading my $HOME directory, which has about thirty mixed files or directories.
Unlike the other benchmarks, which are mostly manipulations of the path, this one requires reading a directory handle and constructing objects from the results. Assuming directly reading is equally efficient, you’re seeing the cumulative effects of the object construction times.
Conclusions 🔗︎
Good benchmarking is difficult. Using Benchmark::Forking eliminates some of the noise, letting us have more confidence in the trends we see.
By taking some extra time to write a harness for my benchmark snippets and a chart generator, I was able to create a lot of benchmarks and visualize them with very little code. Writing new benchmarks is now just a matter of putting snippets into a directory.
The charts show Path::Tiny outperforming on every single benchmark, often by a fairly wide margin. (Remember, those charts were log scale!)
The next article in this series will look at file slurping, the disastrous costs of the common way to do strict Unicode decoding, how File::Slurp lies about binmodes, and how Path::Tiny wound up as the Unicode slurping champion.
Update: Ricardo informs me the correct word is “corpora”.